
Course Modules
📘 Module 1: Data Foundation & Integrity
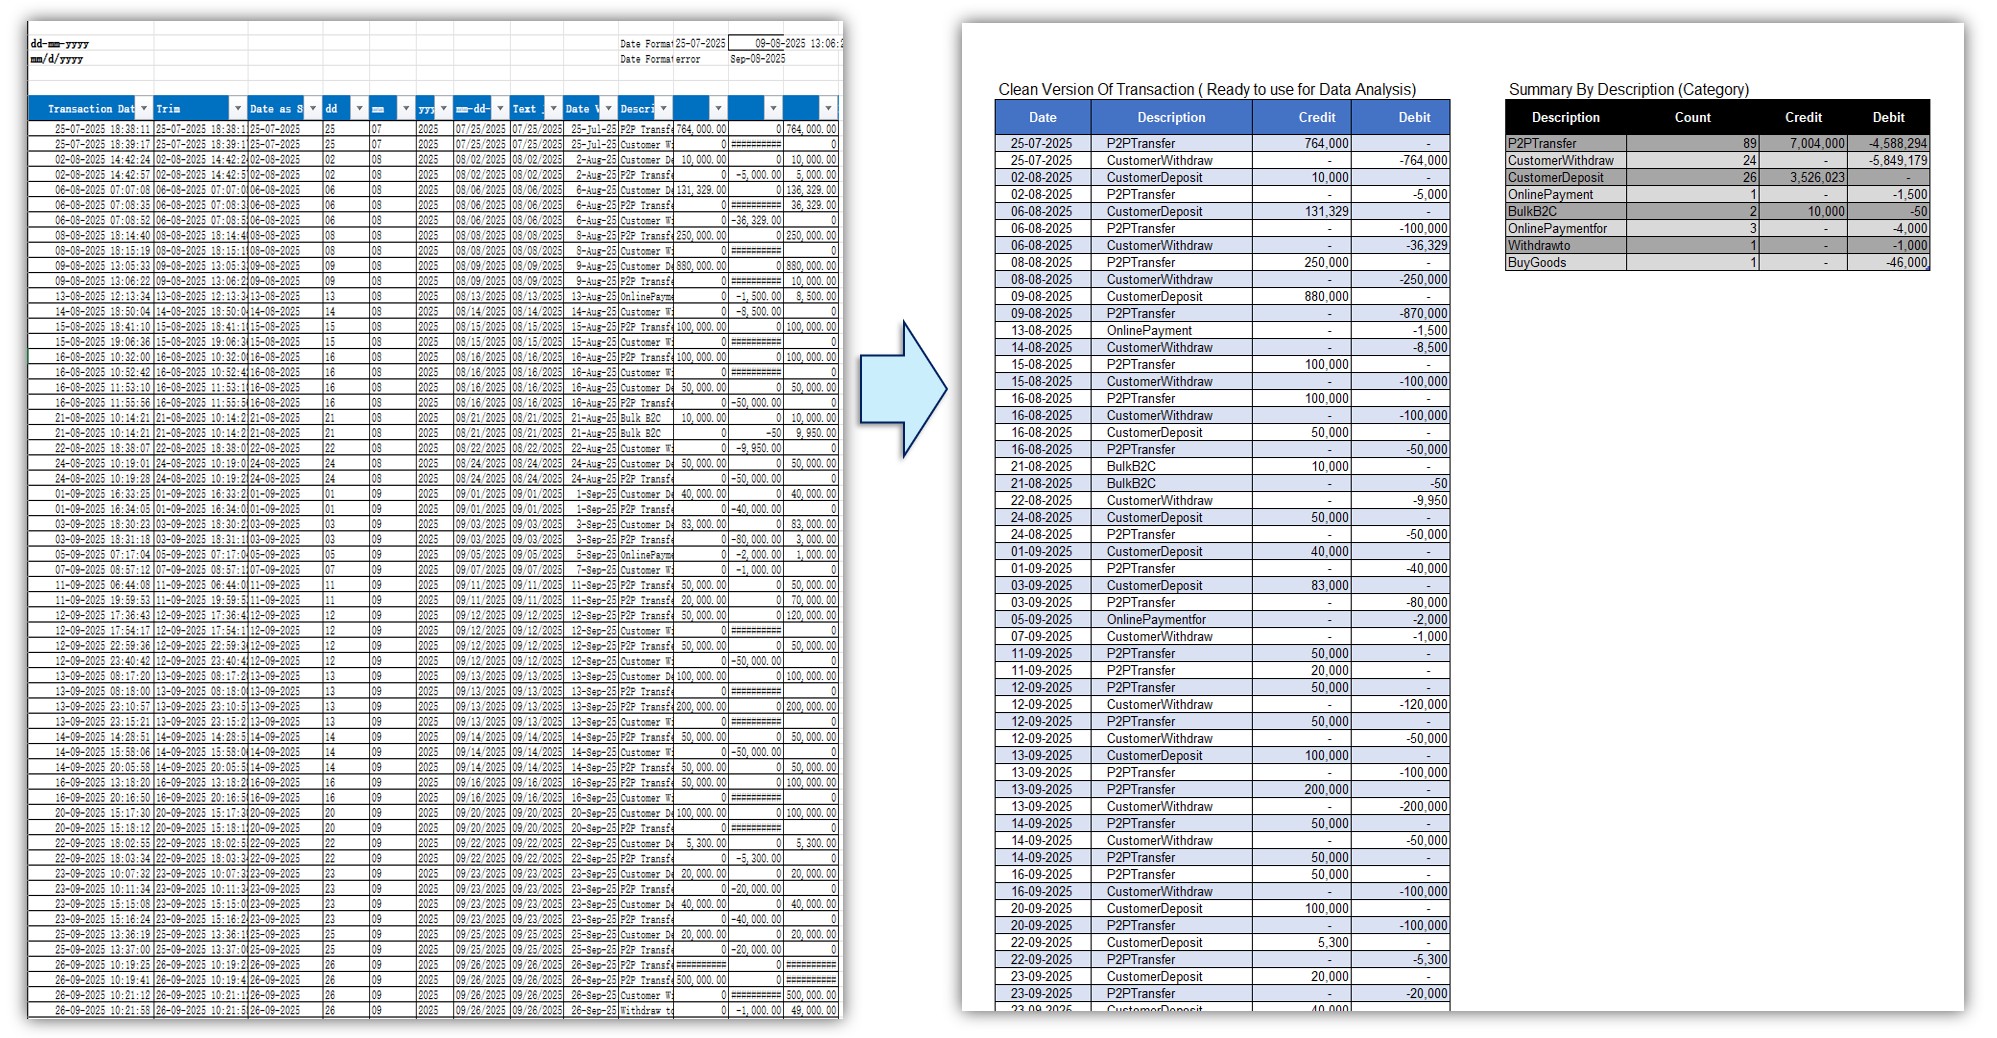
- M1.01 - Bank Statement Cleaning (DATEVALUE & Text to Columns)
- M1.02 - Advanced Cleaning (Date Formulas & TEXTBEFORE)
- M1.03 - Converting Text to Numbers (5 Practical Methods)
- M1.04 - Smart Tables (Advantages & Total Row Feature)
- M1.05 - Dynamic Formulas & Filtering with Slicers
📘 Module 2: Core Business Calculations
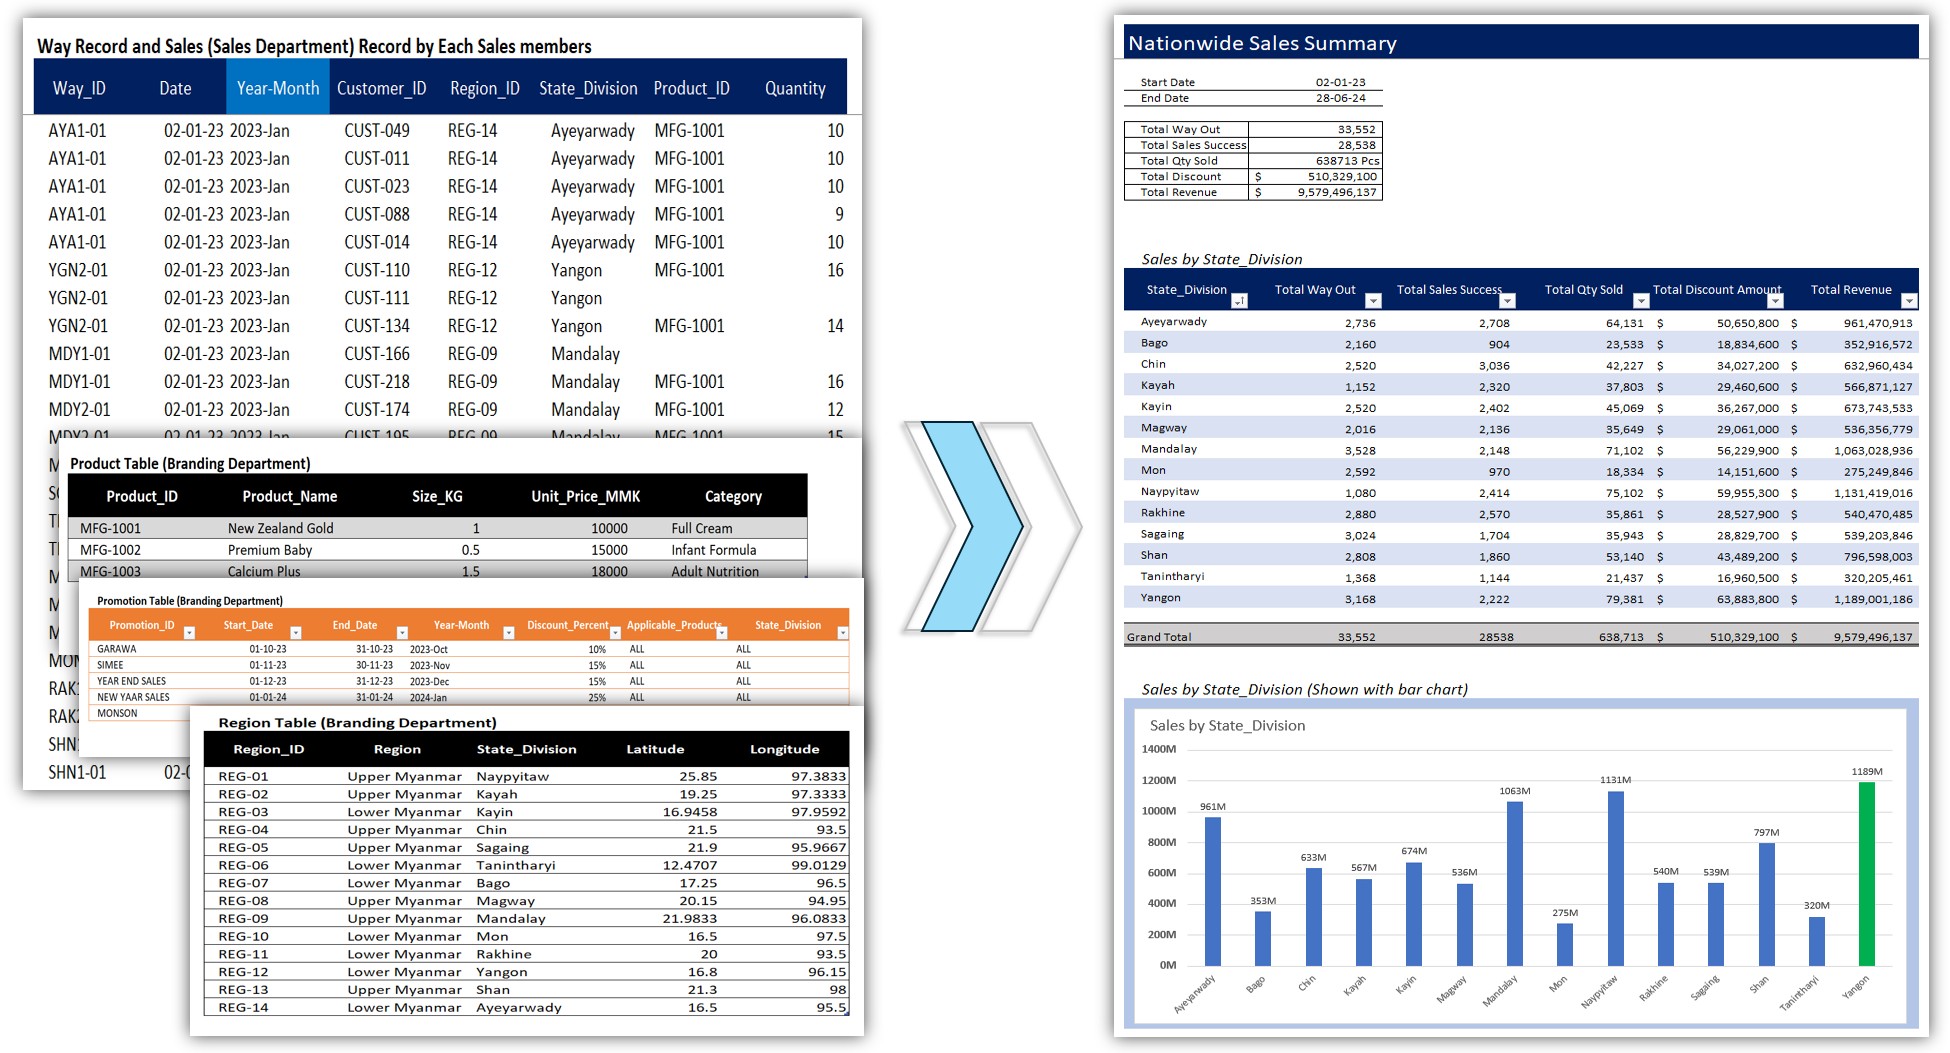
- M2.01 - Row-Level Calculations & Basic Lookups
- M2.02 - Creating a Basic Summary Table (SUM Function)
- M2.03 - Sales Performance Breakdown by Region
- M2.04 - Visualizing Sales Performance (Bar Chart)
📘 Module 3: Advanced Reporting (XLOOKUP & SUMPRODUCT)
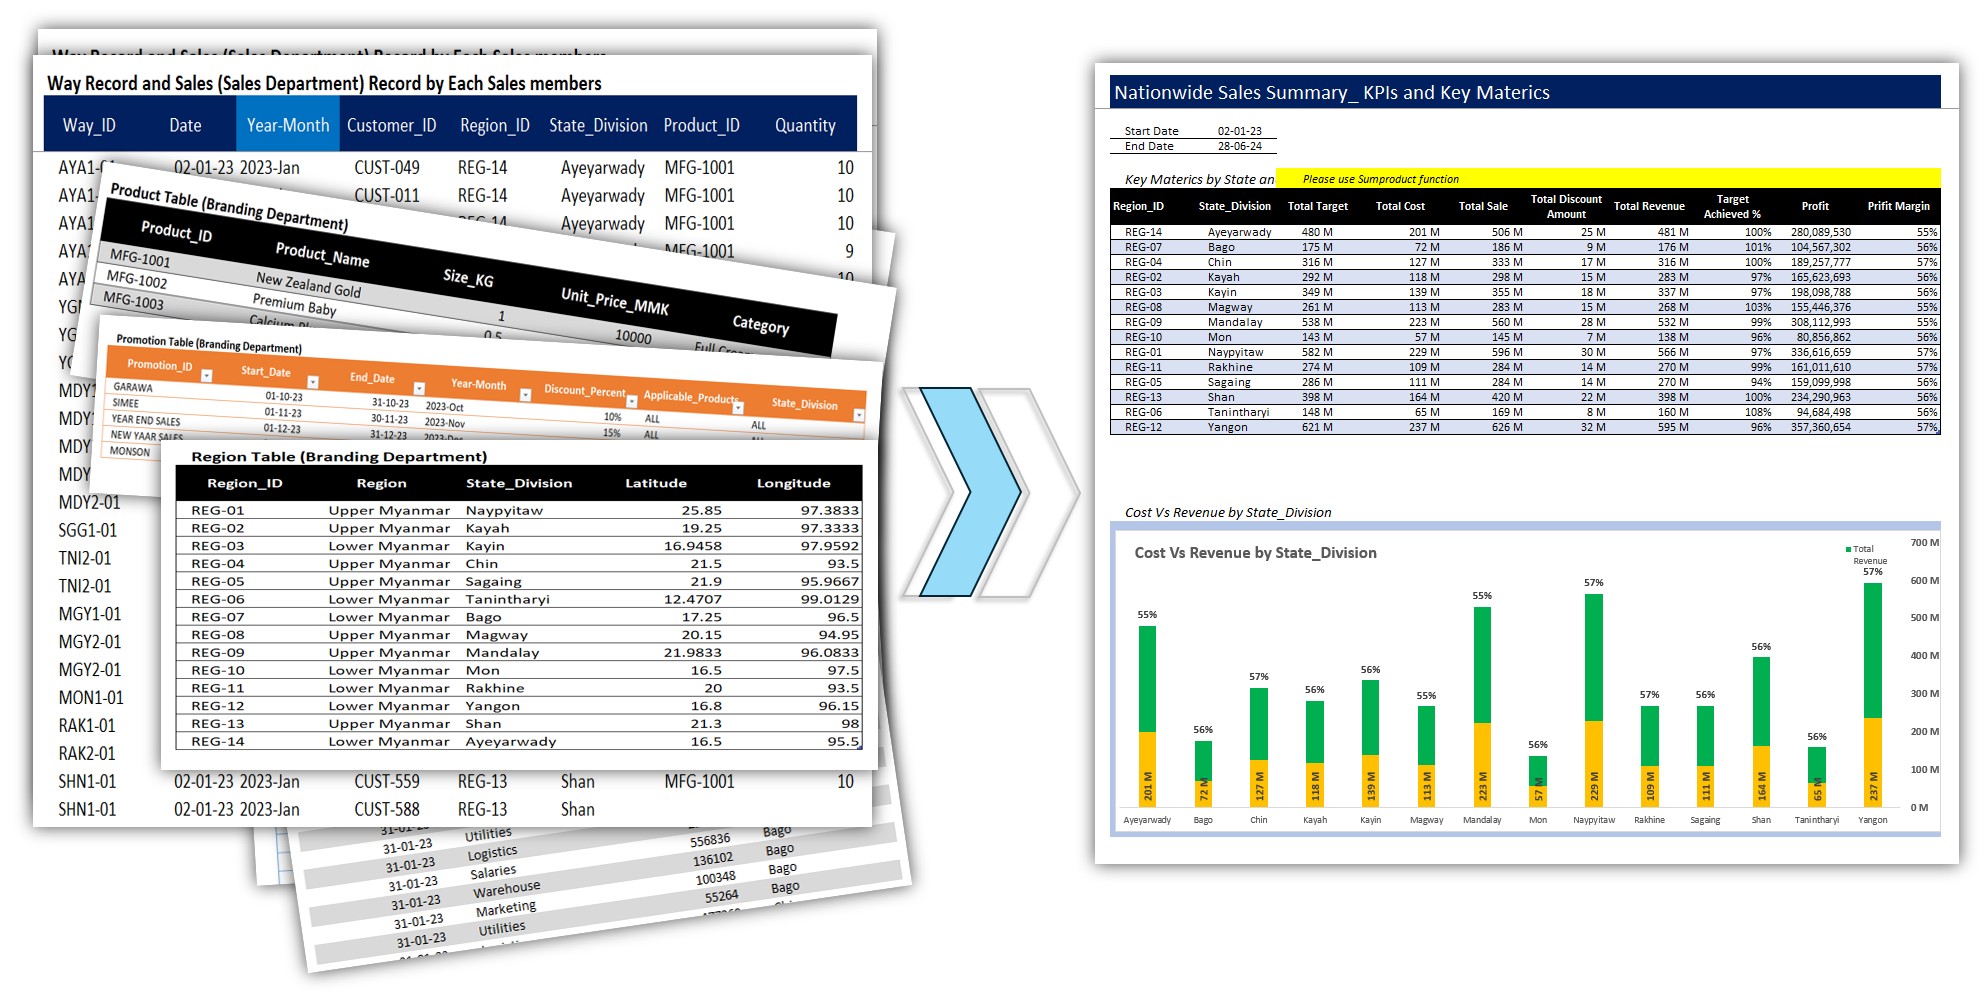
- M3.01 - Mastering XLOOKUP (7 Practical Examples)
- M3.02 - Mastering SUMPRODUCT (7 Advanced Methods)
- M3.03 - Building a Dynamic Customer Summary Table
- M3.04 - Building an Advanced Metrics Report (SUMPRODUCT)
- M3.05 - Building a Professional Stacked Bar Chart (Cost vs Revenue)
📘 Module 4: Pivot & Power Pivot Analysis
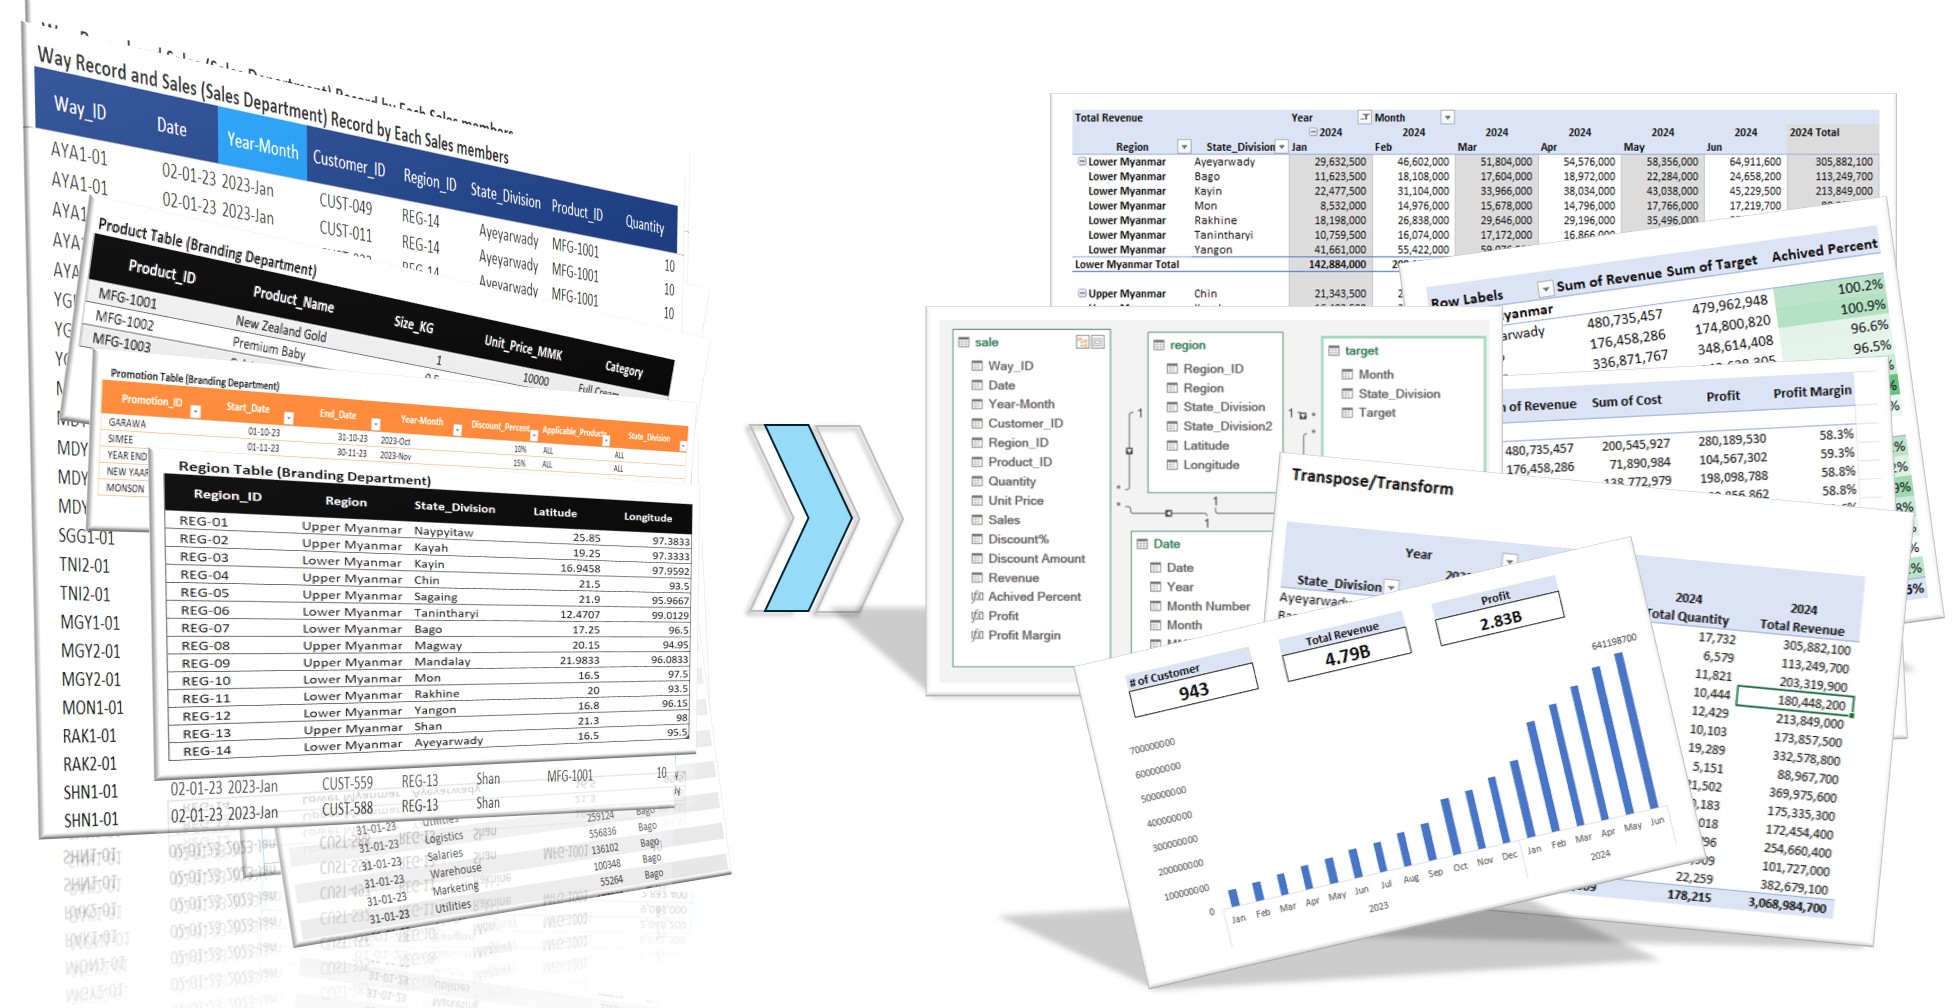
- M4.00 - Module 4 Introduction (PivotTable & Power Pivot)
- M4.01 - Creating Your First PivotTable (with Conditional Formatting)
- M4.02 - PivotTable Calculations (Show Values As %) & Options
- M4.03 - Grouping Data in PivotTables (Manual & Numeric)
- M4.04 - Introduction to PivotCharts (Pie Chart & Key Differences)
- M4.05 - Using 'Show Report Filter Pages' (One-Click Reports)
- M4.06 - Introduction to Power Pivot & the Data Model
- M4.07 - Creating Your First Relationship (Sales & Region Tables)
- M4.08 - Introduction to DAX with a 'Target vs Actual' Measure
- M4.09 - DAX Measures for Cost, Revenue, Profit & Margin
- M4.10 - Why a Date Table is Essential (Common Errors without one)
- M4.11 - Creating & Connecting a Date Table (for Time Analysis)
- M4.12 - Building a Sales Trend Chart (using the Date Table)
- M4.13 - PivotTable Layouts for Time Analysis (Cost vs Revenue)
- M4.14 - Using PivotTable Report Layouts (Compact, Outline, Tabular)
- M4.15 - Transposing Your PivotTable (Moving 'Values' to Rows Columns)
- M4.16 - Connecting Slicers to Multiple PivotTables (Report Connections)
📘 Module 5: Dynamic Dashboard Masterclass
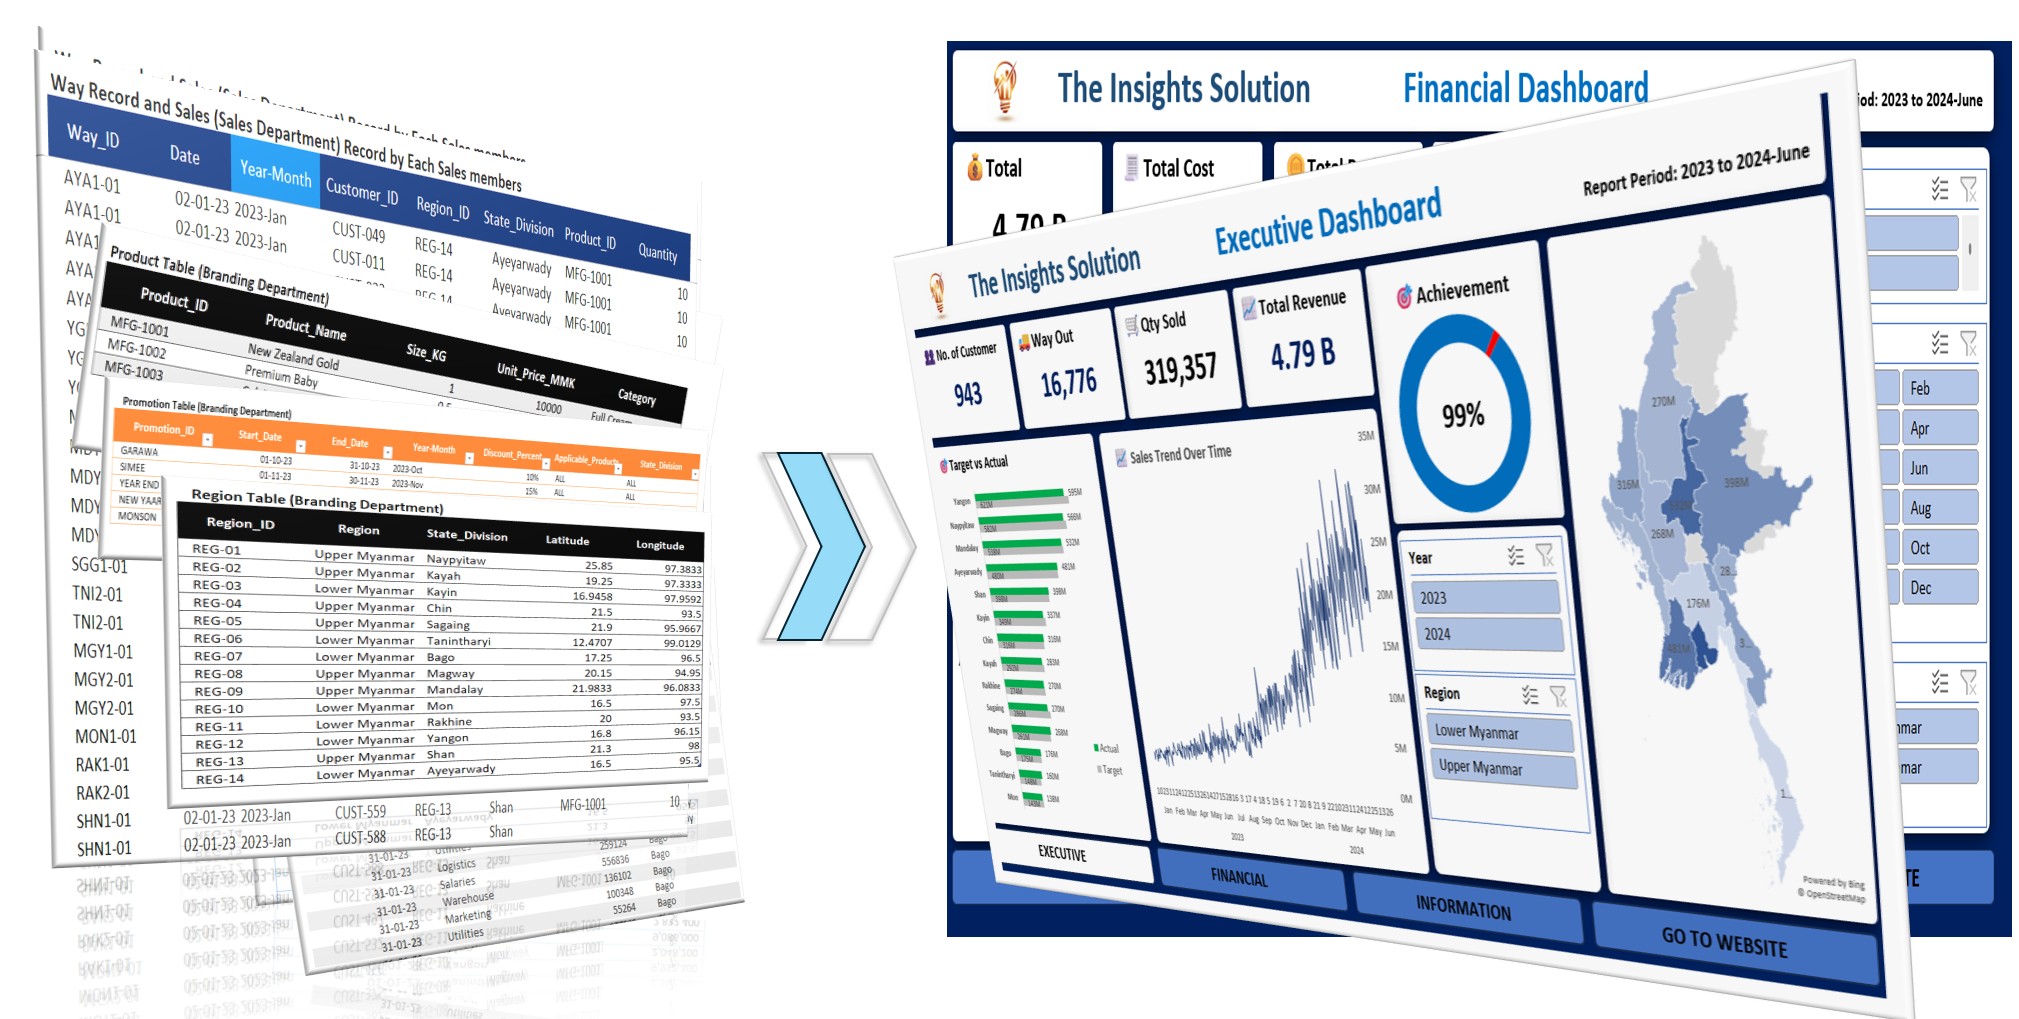
- M5.01 - Building the Dashboard Layout & Frame
- M5.02 - Creating Dashboard Navigation (Linking Pages & URLs)
- M5.03 - Preparing the Dashboard Data Model (Data Flow)
- M5.04 - Building the Executive KPI Cards (PivotTable Linking)
- M5.05 - Building the Achievement Donut Chart (Handling Over 100% with IF)
- M5.06 - Creating a Regional Map Chart (Bridging Pivot Data with VLOOKUP)
- M5.07 - Target vs Actual Chart (Preserving Format with Slicers)
- M5.08 - Finalizing the Executive Dashboard (Sales Trend & Pro Tips)
- M5.09 - Building the Financial KPI Cards (Revenue, Cost & Profit)
- M5.10 - Building Top 5 Revenue Chart (Region & Slicers)
- M5.11 - Financial Combo Chart (Revenue vs Cost vs Margin)
- M5.12 - Creating the Info Page & Full Screen Presentation
📘 Module 6: Practical Business Projects
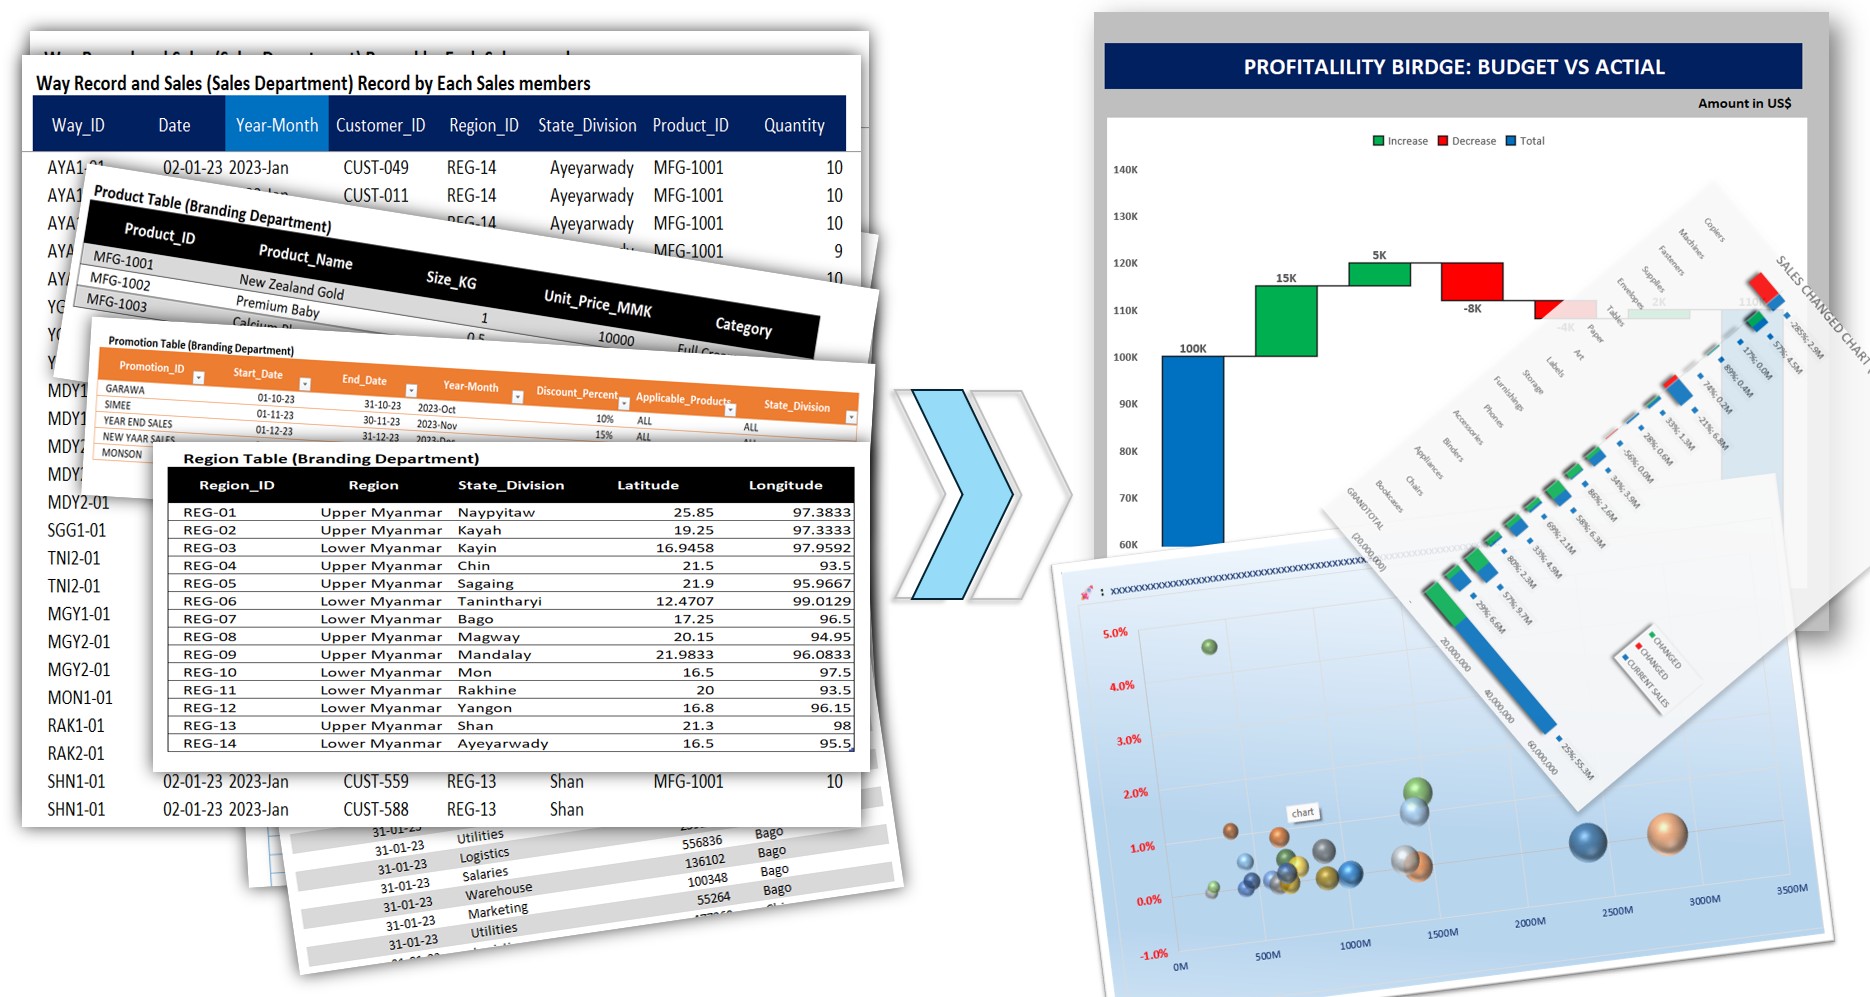
- M6.1 - (Project-1) Profitability Bridge Analysis: Understanding Budget vs Actual
- M6.2 - (Project-2) Sales Change Analysis by Bar Chart
- M6.3 - (Project-3) Branch Efficiency Matrix Marketing ROI Analysis_Intro
- M6.4 - (Project-3) Branch Efficiency Matrix Marketing ROI Analysis
- M6.5 - (Project-4) Coming Soon...